728x90
반응형
파이썬 시각화 도구 기초 관련 글 모음
Seaborn 을 통해 데이터 시각화 하기
시본(Seaborn)은 맷플롯립보다 쉬운 구현, 수려한 시각화, 그리고 편리한 판다스(Pandas) 와의 연동을 특징으로 하고 있다. 시본은 맷플롯립을 기반으로 하고 있지만, 맷플롯립보다 상대적으로 적은 양의 코딩으로도 보다 수려한 시각화 플롯을 제공한다. 또한 판다스의 칼럼명을 기반으로 축 이름을 설정하는 등 편리한 연동 기능을 가지고 있다.
하지만 시본은 맷플롯립을 기반으로 하고, 특정 요소들의 경우 맷플롯립 함수들을 그대로 사용하고 있기에 시본을 잘 활용하려면 반드시 맷플롯립을 어느 정도는 알고 있어야 한다.
Seaborn을 import 할 때는 matplotlib 도 같이 import 되어 있어야 함
import matplotlib.pyplot as plt
%matplotlib inline

import seaborn as sns

x = np.linspace(0, 14, 100)
y1 = np.sin(x)
y2 = 2*np.sin(x+0.5)
y3 = 3*np.sin(x+1.0)
y4 = 4*np.sin(x+1.5)

plt.figure(figsize=(10,6))
plt.plot(x,y1, x,y2, x,y3, x,y4)
plt.show()
"whitegrid" Style 옵션 주기
연습할 데이터셋 불러오기 (tips - 요일별 점심, 저녁, 흡연 여부 / 식사 금액과 팁 정리한 데이터)
박스플롯 만들어보기
plt.figure(figsize=(8,6))
sns.boxplot(x="day", y="total_bill", data=tips)  # x축은 요일, y축은 전체 금액
plt.show()
hue 옵션: 흡연 여부로 구분하기
plt.figure(figsize=(8,6))
sns.boxplot(x="day", y="total_bill", hue="smoker", data=tips, palette="Set3")
plt.show()
lmplot 그려보기
sns.set_style("darkgrid")
sns.lmplot(x="total_bill", y="tip", data=tips)
plt.show()
palette로 색상 지정
sns.lmplot(x="total_bill", y="tip", hue="smoker", data=tips, palette="Set1")
plt.show()
flights 데이터셋 불러오기
flights = sns.load_dataset("flights")
flights.head()
fliight 데이터를 피벗하기
flights = flights.pivot_table(index="month", columns="year", values="passengers")
flights.head(5)
heatmap 그리기
plt.figure(figsize=(10,8)) sns.heatmap(flights, annot=True, fmt="d")
plt.show()
책에서 나온대로 썼더니,
'unknown format code 'd' for object of type 'float'' 이라는 에러 코드가 자꾸 떴다
구글링을 통해, 해당 먼저 flights 데이터를 숫자로 바꿔주고 flight_new 라는 데이터로 만든 후에 다시 했더니
flights_new = flights.round(0).astype(int)

plt.figure(figsize=(10,8))
sns.heatmap(data=flights_new, annot=True, fmt="d")
plt.show()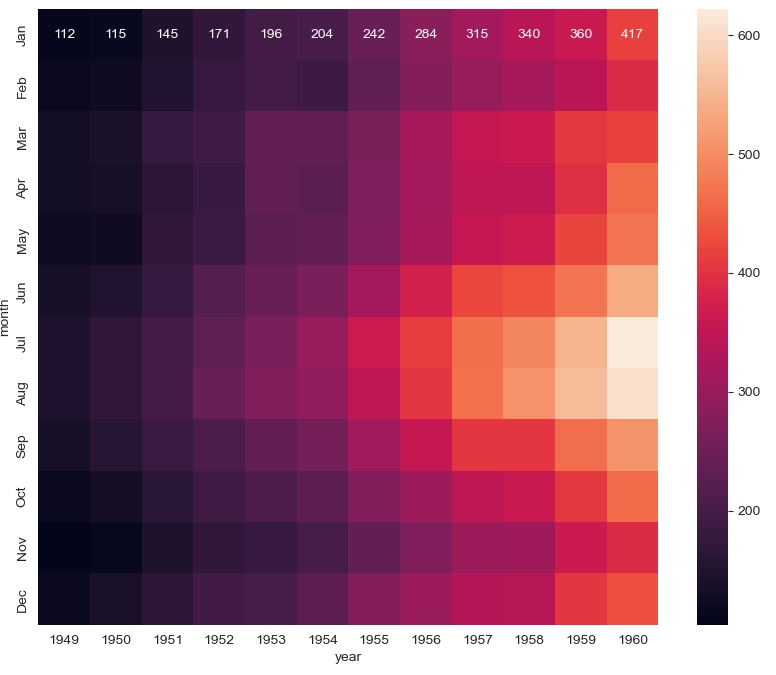
맨 윗줄 수치는 나온다. (그런데 왜 두번째부터 나머지 줄까지는 안 나오는지 모르겠다.. 아시는 분 댓글 좀요ㅠ)
아이리스 꽃 데이터 셋 불러오기
sns.set(style="ticks")
iris = sns.load_dataset("iris")
iris.head(10)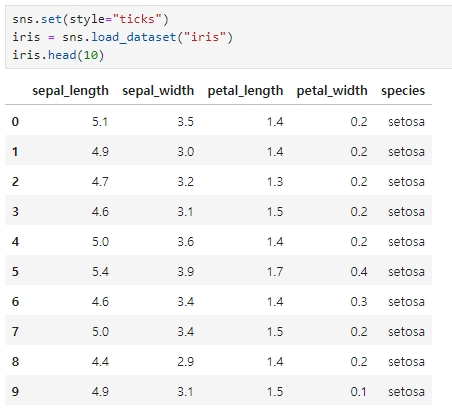
꽃잎, 꽃받침의 너비와 폭을 가지고 종 구분하는 시각화하기
sns.pairplot(iris, hue="species")
plt.show()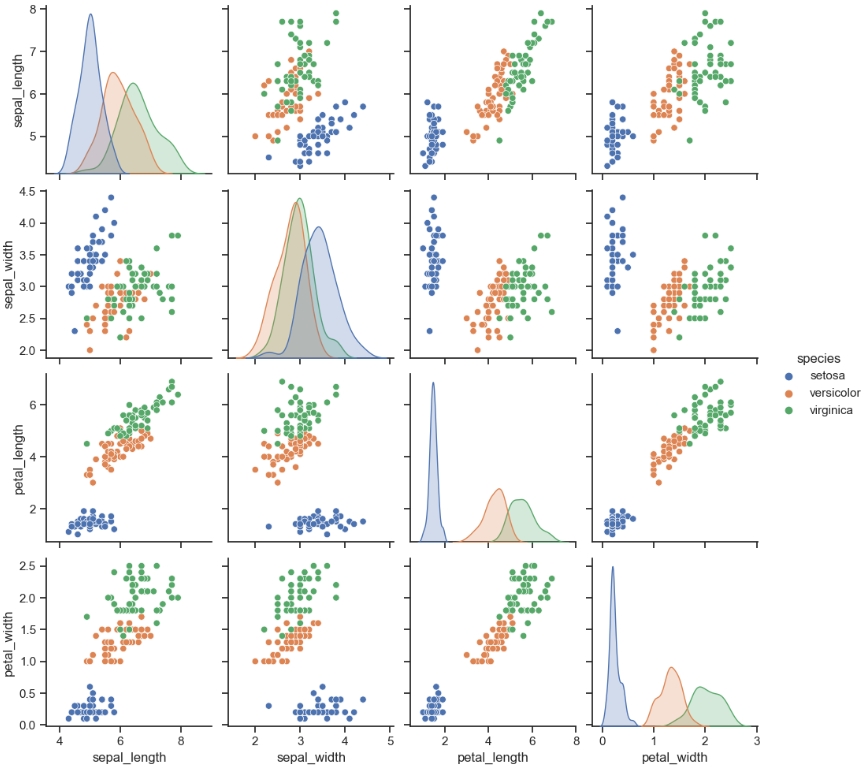
[출처]
파이썬으로 데이터 주무르기
파이썬 머신러닝 완벽 가이드
728x90
반응형
'[파이썬 Projects] > <파이썬 기초>' 카테고리의 다른 글
| [파이썬] Beautiful Soup 익히기 (1) | 2024.04.16 |
|---|---|
| [파이썬] 지도 시각화 도구 - Folium (0) | 2024.04.16 |
| [파이썬] pivot_table (1) | 2024.04.14 |
| [파이썬] 파이썬 시각화 도구 - Matplotlib (0) | 2024.04.13 |
| [파이썬] pandas 고급 기능 : DataFrame 병합하기 (0) | 2024.04.13 |


